
Financial Statement
Red Flags
Ten Warning Signals Every Analyst Should Know
What a Red Flag Really Means
| A red flag is not proof of fraud or manipulation. It is a signal that tells the analyst: “Look deeper.” |
A smart investor does not merely ask: “Is the company making a profit?”
The better questions are:
- Is the profit converting into cash?
- Are sales actually being collected?
- Is debt supporting growth—or covering cash shortages?
- Are margins improving because of genuine efficiency?
- Is accounting policy masking the underlying economics?
- What do the notes to accounts reveal?
Financial statements tell a story. Financial analysis tells us whether that story is economically believable.
1. Sales Up, Cash Down
This is one of the first warning signals an analyst should examine.
Example — Moonlight Ltd.
| Particulars | FY 2024 | FY 2025 | Change |
| Revenue | ₹100 crore | ₹140 crore | +40% |
| EBITDA | ₹18 crore | ₹25 crore | +39% |
| PAT | ₹10 crore | ₹16 crore | +60% |
| Operating Cash Flow | ₹12 crore | ₹3 crore | –75% |
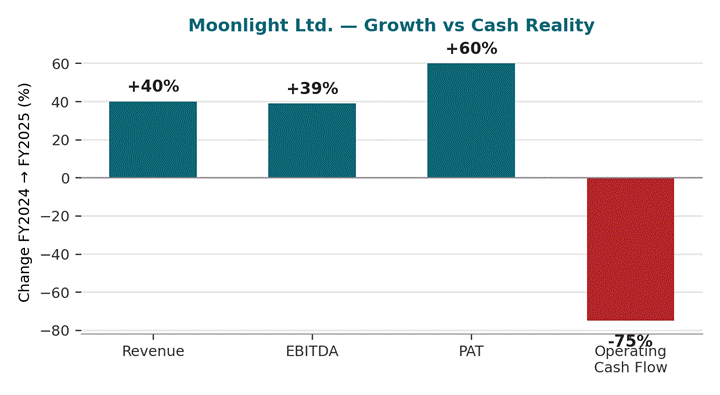
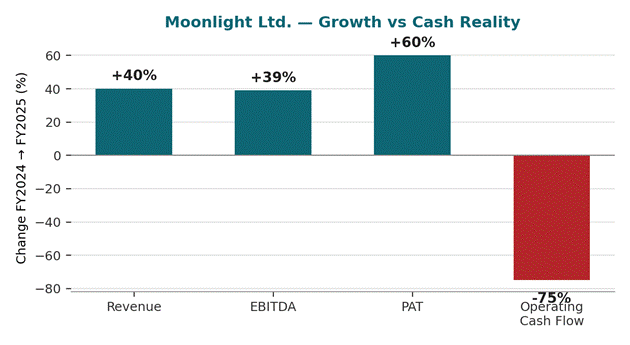
At first glance, Moonlight Ltd. appears to be performing extremely well — revenue up 40%, PAT up 60%. But operating cash flow is down 75%.
What should the analyst ask?
Where did the profit go? Possible explanations include:
- Receivables increased
- Inventory increased
- Customers have not paid
- Revenue was booked before cash collection
- Working capital absorbed cash
| This does not automatically mean aggressive accounting, but it certainly deserves investigation. |
2. Sales Made, Cash Missing
A company can report impressive sales growth while experiencing increasing difficulty in collecting money.
Moonlight Ltd.
| Particulars | FY 2024 | FY 2025 | Growth |
| Revenue | ₹100 crore | ₹120 crore | 20% |
| Trade Receivables | ₹20 crore | ₹34 crore | 70% |
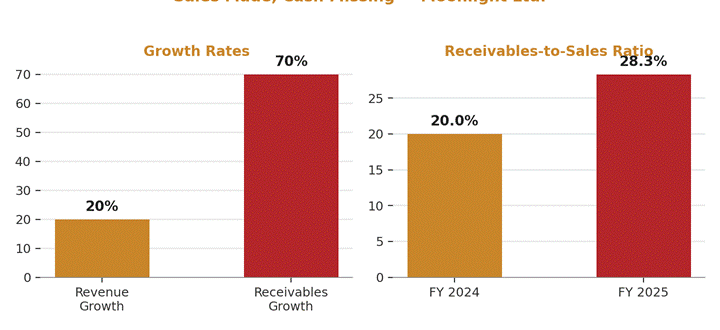
Revenue grew by 20%, but receivables increased by 70%. The receivables-to-sales ratio deteriorated from 20% (FY 2024) to 28.3% (FY 2025) a significant deterioration.
Possible reasons
| Possible Explanation | Interpretation |
| New customers given longer credit | Could be normal |
| Rapid business expansion | May explain some increase |
| Weak collection system | Warning |
| Customer financial stress | Warning |
| Aggressive revenue recognition | Requires investigation |
| Channel stuffing | Serious warning |
| Analyst’s question: Are we seeing genuine sales growth—or sales that have not yet turned into cash? |
3. Changing Rules, Changing Results
Accounting policies are not supposed to be changed simply to make results look attractive. For an analyst, repeated changes deserve attention.
Example
Suppose company changes: Depreciation method → Useful life → Revenue recognition policy over consecutive years. The reported profit may change even though the underlying business has not changed materially.
Example of Impact
| Particular | Old Policy | New Policy |
| Depreciation | ₹20 crore | ₹14 crore |
| Profit Before Tax | ₹50 crore | ₹56 crore |
| Increase in PBT | — | ₹6 crore |
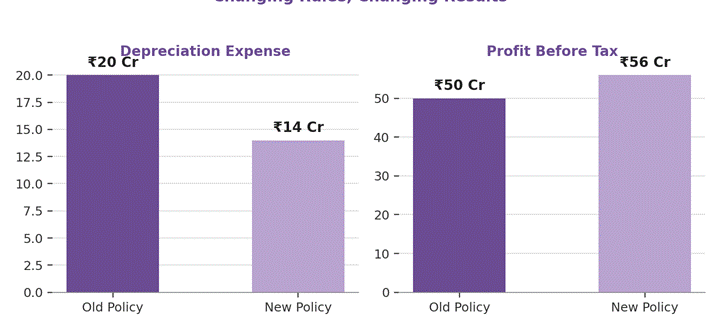
The company may report higher profit simply because depreciation expense has fallen.
Red Flag
A change in accounting policy is not necessarily wrong—but the analyst must understand its financial impact. Look at:
- Accounting policy note
- Change in estimate vs. change in policy
- Comparative figures
- Impact on profit
- Impact on assets
- Auditor’s comments
4. Growth with Shrinking Margins
Revenue growth alone does not guarantee a healthy company.
Example
| Particulars | FY 2024 | FY 2025 |
| Revenue | ₹100 crore | ₹130 crore |
| EBITDA | ₹20 crore | ₹21 crore |
| EBITDA Margin | 20% | 16.2% |
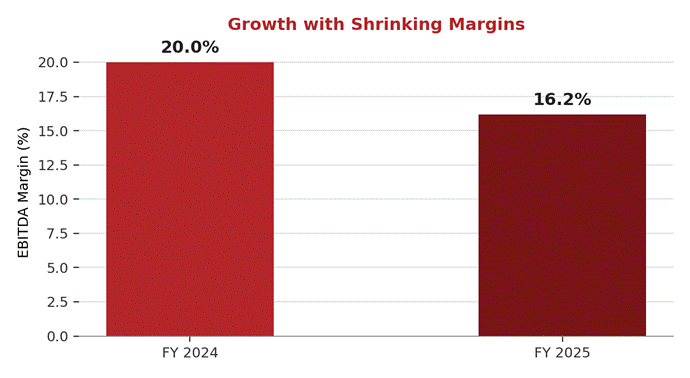
Revenue increased by 30%, but EBITDA increased by only 5%.
What could be happening?
- Raw material prices increased
- Selling prices are under pressure
- Employee costs increased
- Competition intensified
- Operating efficiency deteriorated
| Revenue growth → Gross margin → EBITDA margin → EBIT margin → PAT margin. A company growing rapidly but losing margin may actually be destroying economic value. |
5. More Debt, Less Cash
Debt itself is not a red flag. Unproductive or unsustainable debt is.
| Particulars | FY 2024 | FY 2025 |
| Total Debt | ₹80 crore | ₹125 crore |
| EBITDA | ₹25 crore | ₹27 crore |
| Operating Cash Flow | ₹22 crore | ₹8 crore |
| Interest Expense | ₹7 crore | ₹13 crore |
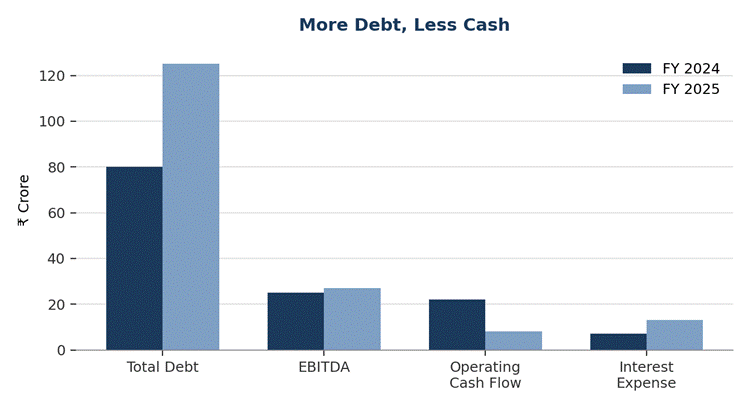
Debt increased by approximately 56%, while operating cash flow declined sharply.
Questions to ask
- Why is debt increasing?
- Is debt financing expansion?
- Is debt being used to finance working capital?
- Is the company refinancing old debt?
- Is interest coverage deteriorating?
- Are loans due for repayment soon?
6. Profit Powered by Non-Core Income
This is a particularly useful red flag for students analysing annual reports.
| Particulars | Amount |
| Operating Profit | ₹30 crore |
| Other Income | ₹15 crore |
| PBT | ₹45 crore |
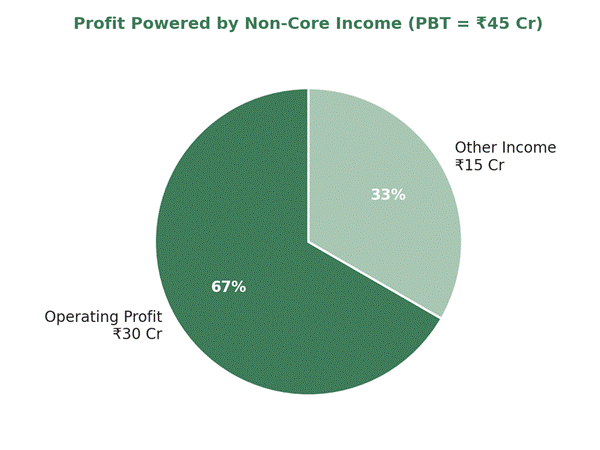
One-third of PBT comes from Other Income. That does not necessarily mean anything is wrong. But the analyst should ask: what exactly is inside Other Income?
- Interest income
- Dividend income
- Gain on sale of investments
- Fair-value gains
- Foreign exchange gains
- One-time gains
- Profit on sale of assets
| Important distinction: Recurring operating profit and one-time gains should not be treated equally when forecasting future performance. |
7. Profit on Paper, Cash in Trouble
This is perhaps one of the most powerful warning signals.
| Year | PAT | Operating Cash Flow |
| FY 2023 | ₹12 Cr | –₹2 Cr |
| FY 2024 | ₹15 Cr | –₹5 Cr |
| FY 2025 | ₹20 Cr | –₹8 Cr |
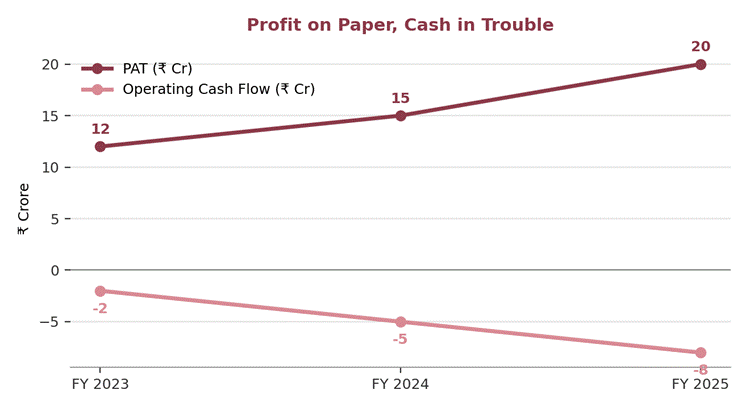
The company reports increasing profits. But cash from operations is continuously negative.
What might explain it?
- Increasing receivables
- Increasing inventory
- Supplier payment changes
- Non-cash accounting gains
- Revenue recognition issues
| The analyst should examine the cash-flow reconciliation from PAT to CFO. |
8. Inventory Growing Faster Than Sales
| Particulars | FY 2024 | FY 2025 | Growth |
| Revenue | ₹100 Cr | ₹115 Cr | 15% |
| Inventory | ₹20 Cr | ₹32 Cr | 60% |
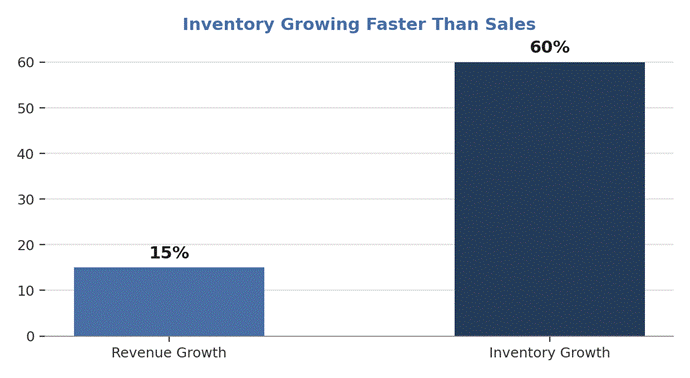
Inventory is growing four times faster than revenue.
Why should we care? It may indicate:
- Slow-moving inventory
- Obsolete inventory
- Weak demand
- Overproduction
- Incorrect inventory valuation
- Delayed sales
Analyst’s checklist
- Inventory days
- Inventory turnover
- Provision for obsolete / slow-moving stock
- Finished goods vs. raw materials
| Sales should normally provide economic justification for inventory growth. Not always—but a major divergence requires investigation. |
9. Related-Party Transactions
This is particularly important when analysing Indian listed companies. A company may have transactions with promoters, directors, subsidiaries, associate companies, joint ventures, and companies controlled by key management personnel.
Example — Moonlight Ltd.
| Transaction | Amount |
| Revenue from external customers | ₹100 Cr |
| Sales to related parties | ₹25 Cr |
| Loans/advances to related parties | ₹15 Cr |
| Purchase from related parties | ₹20 Cr |
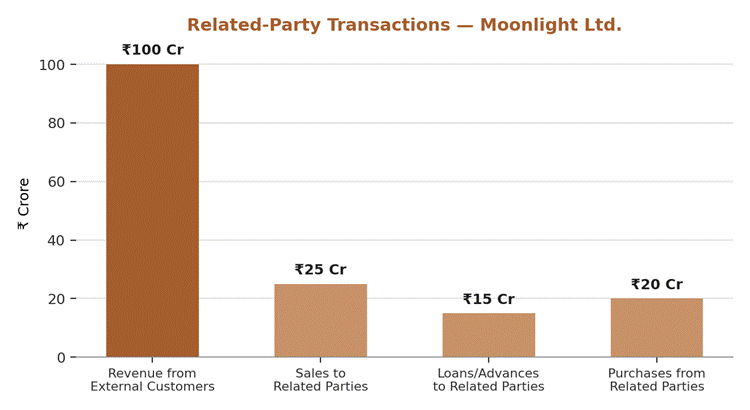
The existence of related-party transactions does not mean wrongdoing. But the analyst should ask: are these transactions conducted on normal commercial terms?
Examine
- Nature of transaction
- Amount
- Outstanding balance
- Pricing
- Guarantees
- Loans/advances
- Terms and conditions
- Board/shareholder approvals where applicable
| The Notes to Accounts are therefore extremely important. |
10. Auditor’s Report and Contingent Liabilities
This deserves a separate section because many readers focus only on the income statement.
Auditor’s report — look for:
- Qualified opinion
- Adverse opinion
- Disclaimer of opinion
- Emphasis of Matter
- Material uncertainty
- Key Audit Matters
- Significant internal-control observations
Contingent liabilities
| Particular | Amount |
| Net worth | ₹150 Cr |
| Reported profit | ₹20 Cr |
| Contingent tax litigation | ₹35 Cr |
| Other legal claims | ₹20 Cr |
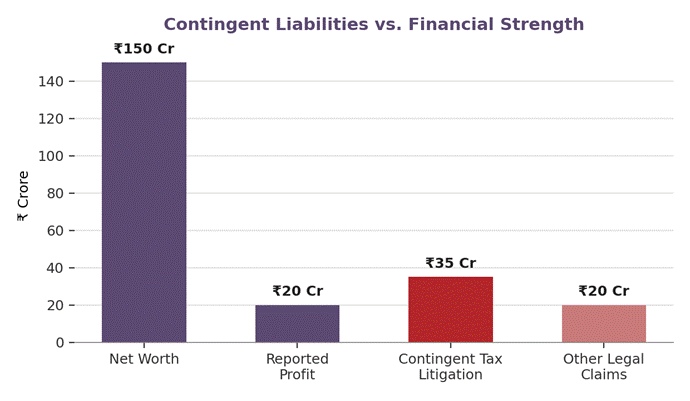
The company may look profitable today, but the potential obligations are material compared with its financial strength.
| Important lesson: A liability that is not yet recognised on the balance sheet can still be economically important. Therefore: Balance Sheet + Notes to Accounts + Auditor’s Report must be read together. |
Red Flag Dashboard — 10 Signals
We can now convert the entire discussion into a powerful analytical table.
| # | Red Flag | What to Compare | What It May Indicate |
| 1 | Revenue ↑ faster than CFO | Revenue vs CFO | Collection / revenue-recognition concern |
| 2 | Receivables ↑ faster than sales | Debtors vs revenue | Collection problems |
| 3 | Frequent accounting-policy changes | Policy notes | Comparability / manipulation risk |
| 4 | Profit margins ↓ | EBITDA / PAT margins | Cost or pricing pressure |
| 5 | Debt ↑ + CFO ↓ | Debt vs CFO | Liquidity / solvency pressure |
| 6 | Other income unusually high | Operating profit vs other income | Non-recurring earnings |
| 7 | PAT ↑ but CFO consistently negative | PAT vs CFO | Poor earnings quality |
| 8 | Inventory ↑ faster than sales | Inventory vs revenue | Slow-moving / obsolete stock |
| 9 | Significant related-party transactions | RPT vs revenue / net worth | Governance / pricing concerns |
| 10 | Auditor qualifications / large contingencies | Audit report + notes | Hidden financial / legal risk |
| A red flag is a starting point for enquiry, not a verdict. The disciplined analyst reads the numbers, the notes, and the narrative together before forming a view. |
Thank you sir , it is very easily explained from the perspective of a financial analyst .