

A Comprehensive Ratio Analysis from the Perspective of Different Stakeholders
THE BACKSTORY
Company Profile
GoodLuck Ltd. is a medium-sized manufacturing company producing engineering components for domestic and industrial customers. Over the past few years, it has expanded production capacity by investing in new machinery and infrastructure. Sales have grown steadily — but the Board of Directors wants to know one thing: is the company actually using its resources efficiently?
As at 31st March 2026, the Board is weighing four big decisions, and has appointed a Financial Consultant to guide them with hard numbers:
- Apply for additional working capital finance from a commercial bank
- Attract new investors for future expansion
- Review its dividend policy
- Evaluate the company’s operational efficiency
| Why these matters Ratio analysis turns a static Balance Sheet into a diagnostic tool — it tells lenders whether the company can repay investors whether it can grow, and tells management where cash is quietly getting stuck. |
THE NUMBERS BEHIND THE STORY
Balance Sheet as at 31st March 2026
| Liabilities | ₹ | Assets | ₹ |
| 6% Preference Share Capital | 1,50,000 | Goodwill | 20,000 |
| Equity Share Capital | 2,50,000 | Land & Building | 2,50,000 |
| General Reserve | 20,000 | Machinery | 1,75,000 |
| Profit & Loss Account | 15,000 | Furniture | 10,000 |
| 5% Debentures | 1,00,000 | Stock | 90,000 |
| Sundry Creditors | 28,000 | Sundry Debtors | 21,000 |
| Bills Payable | 12,000 | Cash at Bank | 5,000 |
| Preliminary Expenses | 4,000 | ||
| Total | 5,75,000 | Total | 5,75,000 |
Additional information: Total Sales ₹4,00,000 • Credit Sales = 20% of Total Sales • Gross Profit ₹80,000 • Net Profit (after tax) ₹20,000
AT A GLANCE
The Ratio Analysis Scorecard
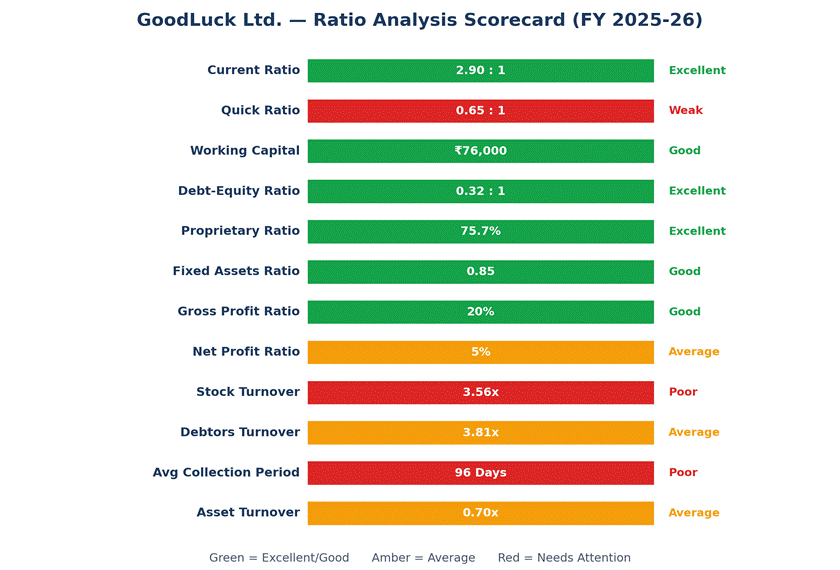
Twelve ratios, four lenses, one clear picture. Here’s how GoodLuck Ltd. scores across liquidity, solvency, profitability and efficiency:
CAN IT PAY ITS BILLS?
1. Liquidity Analysis
Liquidity ratios test whether GoodLuck Ltd. can meet its short-term obligations without breaking a sweat. The headline number looks great — but there’s a catch hiding underneath it.
| Ratio | Formula | Calculation | Result | Ideal | Status |
| Current Ratio | Current Assets ÷ Current Liabilities | 1,16,000 ÷ 40,000 | 2.90 : 1 | 2 : 1 | Excellent |
| Quick Ratio | (Current Assets − Inventory) ÷ Current Liabilities | (1,16,000−90,000) ÷ 40,000 | 0.65 : 1 | 1 : 1 | Weak |
| Working Capital | Current Assets − Current Liabilities | 1,16,000 − 40,000 | ₹76,000 | Positive | Good |
Current Ratio comfortably beats the benchmark, but Quick Ratio reveals inventory is doing the heavy lifting.
| Consultant’s take The Current Ratio suggests excellent short-term solvency and adequate working capital for daily operations. But the Quick Ratio tells a different story: strip out inventory, and immediate liquidity is weak — a large share of current assets is tied up in stock rather than cash or receivables. |
IS IT BUILT ON SOLID GROUND?
2. Solvency & Capital Structure
Solvency ratios look past this year and into the long run — how much of the company is funded by owners versus outside lenders, and can it survive a downturn?
| Ratio | Formula | Calculation | Result | Ideal | Status |
| Debt–Equity Ratio | Outside Liabilities ÷ Shareholders’ Funds | 1,40,000 ÷ 4,35,000 | 0.32 : 1 | 1 : 1 | Excellent |
| Proprietary Ratio | Shareholders’ Funds ÷ Total Assets | 4,35,000 ÷ 5,75,000 | 75.7% | Above 50% | Excellent |
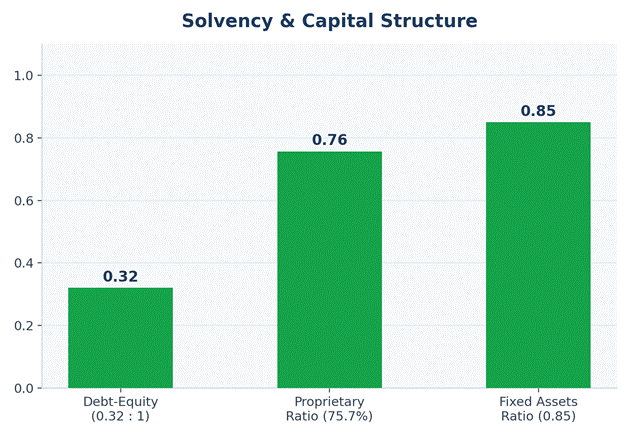
| Fixed Assets Ratio | Fixed Assets ÷ Long-term Funds | 4,55,000 ÷ 5,35,000 | 0.85 | Below 1 | Good |
Low leverage, high owner-funding, and fixed assets comfortably covered by long-term funds.
| Consultant’s take GoodLuck Ltd. leans very little on outside borrowings and finances a large share of its assets from owners’ funds — a strong capital structure that should reassure both bankers and prospective investors. Long-term funds are more than sufficient to finance fixed assets without relying on short-term borrowings. |
IS IT ACTUALLY MAKING MONEY?
3. Profitability
Margins reveal how much of every rupee of sales survives the trip from revenue to profit.
| Ratio | Formula | Calculation | Result | Ideal | Status |
| Gross Profit Ratio | Gross Profit ÷ Net Sales × 100 | 80,000 ÷ 4,00,000 × 100 | 20% | Higher is better | Good |
| Net Profit Ratio | Net Profit ÷ Net Sales × 100 | 20,000 ÷ 4,00,000 × 100 | 5% | Higher is better | Average |
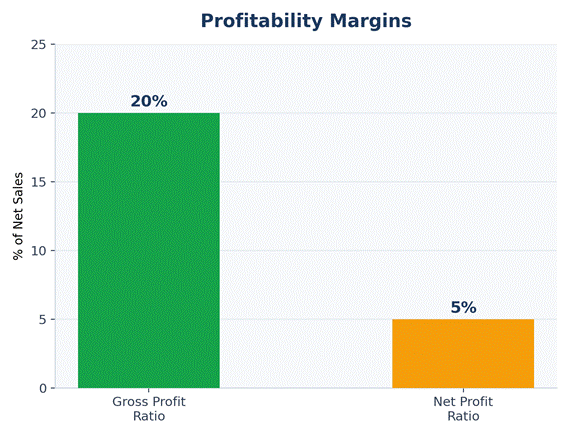
A healthy 20% gross margin shrinks to just 5% at the net level.
| Consultant’s take The 20% gross margin points to efficient production and pricing. But by the time operating expenses, interest and tax are paid, only 5% is left on the table — a sign that cost control below the gross-profit line deserves closer attention. |
IS IT USING ITS ASSETS WELL?
4. Efficiency
Efficiency ratios show how hard GoodLuck Ltd.’s assets, stock and receivables are working for it — and this is where the biggest red flags show up.
| Ratio | Formula | Calculation | Result | Ideal | Status |
| Stock Turnover Ratio | Cost of Goods Sold ÷ Average Inventory | 3,20,000 ÷ 90,000 | 3.56x | 6–8 times | Poor |
| Debtors Turnover Ratio | Credit Sales ÷ Average Debtors | 80,000 ÷ 21,000 | 3.81x | Higher is better | Average |
| Average Collection Period | 365 Days ÷ Debtors Turnover | 365 ÷ 3.81 | 96 Days | 30–60 days | Poor |
| Asset Turnover Ratio | Net Sales ÷ Total Assets | 4,00,000 ÷ 5,75,000 | 0.70x | Higher is better | Average |
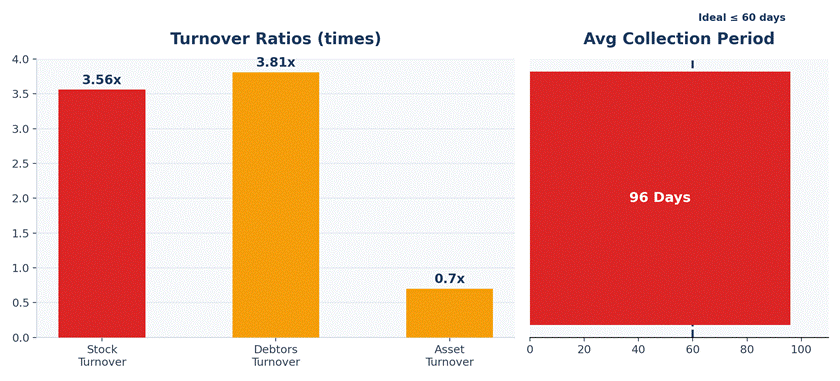
Inventory turns slowly, customers take 96 days to pay, and total assets aren’t fully pulling their weight.
| Consultant’s take Slow inventory movement suggests excess stock and higher carrying costs. Customers take far longer than the ideal 30–60 days to pay, straining liquidity and cash management. Together with modest asset turnover, this points to operational efficiency — not solvency — as GoodLuck Ltd.’s real challenge. |
THE BOTTOM LINE
Consultant’s Final Opinion
From an overall financial perspective, GoodLuck Ltd. is a financially sound company with a strong capital structure, healthy liquidity, and low financial risk. These strengths make it attractive to banks, lenders, and long-term investors.
However, operational efficiency requires improvement. Excess inventory, slow collection from debtors, and underutilisation of assets are affecting profitability and cash conversion.
| Recommendation If management focuses on improving working capital management, inventory control, and receivables collection, GoodLuck Ltd. will be better positioned to enhance profitability, strengthen cash flows, and create greater value for shareholders. |
Prof. Dr. Sujit Dutta
Financial Statement Analysis of GoodLuck Ltd. — Ratio Analysis Report
Very Very Insightful , thank you sir for such an interesting blog
This blog Really helps to understand the ratio which is most important topic about accounting
Like me many students are still confused in ratio, but now you have brought a great solution to this.
Appreciate your work, sir
Such a practical approach to make this topic very easy to understand . Thank you sir for the explanation on ratios with example.
Very informative blog!!! Great for a detailed knowledge