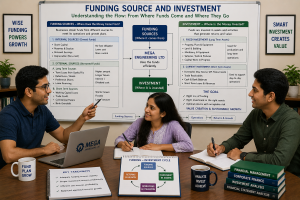
Having examined the funding side of the Balance Sheet in our last blog, it is equally important to understand how these funds are deployed within the business. This tells us that whatever funds a business raises—whether from owners (equity) or borrowings (debt) must be fully utilised in acquiring assets. But the real question is: how are these funds used within the business?
In practice, there is a logical pattern in the utilisation of funds:
- Long-term funds (equity and long-term borrowings) are generally used for acquiring fixed assets such as plant, machinery, and buildings, as well as intangible assets like patents, technical know-how, and licenses.
- A portion of these long-term funds may also support working capital, especially to maintain a stable base of operations.
- Short-term funds (like trade payables or short-term borrowings) are typically used to finance current assets, such as inventory, receivables, and cash.
The asset side reflects the investment decisions of the company—where and how the funds raised from equity and debt are utilized.
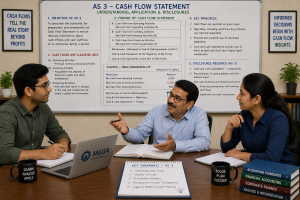
This naturally connects with AS 3 Cash Flow Statement, where cash flows from investing activities capture the movement of funds into and out of long-term assets, such as:
- Purchase or sale of fixed assets
- Investments in subsidiaries or securities
- Capital expenditure on projects
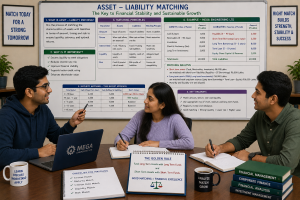
Integrated Insight: Matching Funding with Investment
- Long-term funds → Should finance fixed assets
- Short-term funds → Should finance current assets
This matching the source of funds with their use is crucial for maintaining financial stability. If long-term assets are financed with short-term funds, or vice versa, it may lead to liquidity problems and financial stress.
In this blog, we will explore this relationship through a case study and connect it with key financial ratios, helping you understand not just the Balance Sheet equation, but the story behind it.
Case Study: Business Funding and Key Financial Ratios
Background
Elenergy Industries Ltd is a mid-sized manufacturing company planning expansion. A bank is evaluating its loan proposal by analyzing:
- Funding side (liabilities) → How funds are raised
- Asset side (investments) → How funds are used
This integrated approach helps assess whether the company maintains a balanced and efficient financial structure.
Financial Snapshot (Rs. in crore)
Liabilities (Funding Side)
| Particulars | Amount |
| Equity Share Capital | 2.0 |
| Reserves & Surplus | 1.0 |
| Shareholders’ Funds | 3.0 |
| Long-term Debt | 4.0 |
| Preference Share Capital | 1.0 |
| Current Liabilities | 2.0 |
| Total | 10.0 |
| Particulars | Amount |
| Net Fixed Assets | 6.0 |
| Current Assets | 4.0 |
| Total Assets | 10.0 |
Assets (Investment side)
Additional Information
| Particulars | Amount |
| Revenue | 20.0 |
| EBIT | 2.5 |
| Interest Expense | 1.0 |
Funding Ratios
| Ratio | Formula | Result |
| Debt–Equity Ratio | Debt / Equity (4 / 3) | 1.33: 1 |
| Capital Gearing | (Debt + Pref.) / Equity = (5 / 3) | 1.67: 1 |
| Net Worth Ratio | Equity / Total Assets (3 / 10) | 30% |
| Interest Coverage (ICR) | EBIT / Interest (2.5 / 1.0) | 2.5 times |
Asset Ratios
| Ratio | Formula | Result |
| Fixed Asset Turnover | Sales / Fixed Assets (20 / 6) | 3.33 times |
| Total Asset Turnover | Sales / Total Assets (20 / 10) | 2.0 times |
| Current Ratio | Current Assets / Current Liabilities (4 / 2) | 2: 1 |
| Working Capital Turnover | Sales / WC (20 / 2) | 10 times |
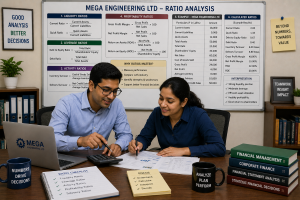
Integrated Interpretation (Lender’s perspective)
1. Funding Analysis
- Moderate leverage (D/E = 1.33)
- Some pressure due to fixed obligations (gearing = 1.67)
- Interest coverage is adequate but not very strong (2.5 times)
Conclusion: Manageable risk, but sensitive to profit fluctuations
2. Investment Efficiency
- Strong utilization of fixed assets (3.33 times)
- Good overall efficiency (2.0 times)
- Healthy liquidity position (Current Ratio = 2:1)
Conclusion: Assets are being efficiently deployed
3. Matching Principle (Most important insight)
Funding vs Investment Alignment
| Funding Source | Asset Use | Observation |
| Long-term funds (Equity + Debt = 7) | Fixed Assets (6) | Properly matched |
| Short-term funds (CL = 2) | Current Assets (4) | Adequately supported |
Indicates sound financial planning
Link with Cash Flow Perspective
Under AS 3 Cash Flow Statement:
- Financing activities → Explain how Rs.10 crore was raised
- Investing activities → Explain how Rs.10 crore was deployed
Ratios + Cash Flow = Complete financial story
Overall Credit View
| Aspect | Observation | Risk level |
| Solvency | Moderate leverage | Manageable |
| Liquidity | Strong | Low Risk |
| Efficiency | High | Positive |
| Coverage | Adequate | Moderate |
| Overall position | Balanced structure | Cautious approval |
Takeaway:
- Balance Sheet must be read from both sides together
- Funding decisions impact risk
- Investment decisions impact efficiency
Lenders evaluate alignment between the two