
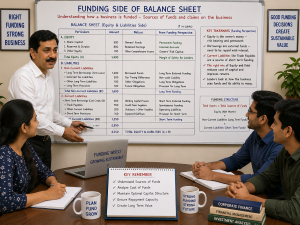
When we analyze the liability side of the Balance Sheet, we are essentially looking at the sources of funds—primarily shareholders’ equity and borrowings. However, the Balance Sheet presents only a snapshot at a point in time. To truly understand how these funds are raised, repaid, or managed over a period, we must look beyond and connect it with the cash flow statement.
This is why AS 3 -Cash Flow Statement becomes highly relevant. Under AS 3, cash flows from financing activities capture transactions that directly impact the funding structure of a business, such as:
- Issue of shares or debentures
- Borrowing and repayment of loans
- Payment of interest and dividends
These activities explain how the liability side of the Balance Sheet evolves over time.
For students, this connection is crucial. While ratios like Debt–Equity Ratio and Interest Coverage Ratio (ICR) help assess financial risk and repayment capacity, financing cash flows reveal the actual movement of funds behind those numbers.
In this blog, we will integrate both perspectives—ratio analysis and cash flow insights—to develop a more comprehensive understanding of how businesses manage their funding and how lenders evaluate financial strength.
When we look at a Balance Sheet, the liability side represents the sources of funds—how a business finances its assets. These funds broadly come from two major sources: shareholders’ equity and borrowed funds (debt).
Among these, shareholders’ equity plays a foundational role. It reflects the owners’ stake in the business and acts as a financial shield for creditors. A strong equity base not only enhances the company’s stability but also improves its ability to raise additional funds from financial institutions.
Because of its importance, several financial ratios are built around shareholders’ equity. These ratios help us understand:
- How much the company relies on owners’ funds versus borrowed funds
- The level of financial risk taken by the business
- The efficiency in using shareholders’ capital
Let’s start with a small case study, where we look at how a company is funded. From there, we will link these funding sources to important financial ratios and understand their significance from a lenders and accounting perspective.

Case Study: Business funding and related financial ratios
Background
Mega Engineering Ltd is a mid-sized manufacturing company planning to raise funds for expansion. Before granting additional finance, the bank and analysts evaluate the company’s financial strength, efficiency, and risk profile using key ratios linked to shareholders’ equity.
Financial Data (Rs. in Crore)
| Particulars | Rs. |
| Equity Share Capital | 2.0 |
| Reserves & Surplus | 1.0 |
| Shareholders’ Funds (Net Worth) | 3.0 |
| Long-term Debt | 4.0 |
| Preference Share Capital | 1.0 |
| Total Capital Employed | 8.0 |
| Total Assets | 8.0 |
| Revenue (Sales) | 16.0 |
| EBIT | 2.4 |
| Interest Expense | 0.8 |
| Net Profit (after interest & tax) | 1.2 |
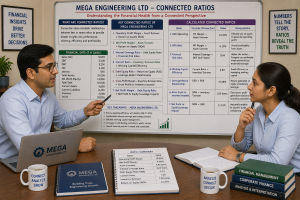
Key Ratios Computed
| Ratio | Formula | Calculation | Result |
| Net Worth Ratio (Equity-To-Asset ratio) | Net Worth / Total Assets | 3.0 / 8.0 | 0.375 (37.5%) |
| Capital Turnover | Sales / Capital Employed | 16.0 / 8.0 | 2.0 times |
| Capital Gearing | Fixed Cost Funds / Equity | (4.0 + 1.0) / 3.0 | 1.67: 1 |
| Return on Equity (ROE) | Net Profit / Equity | 1.2 / 3.0 | 40% |
| Debt–Equity Ratio | Debt / Equity | 4.0 / 3.0 | 1.33: 1 |
| Interest Coverage Ratio (ICR) | EBIT / Interest | 2.4 / 0.8 | 3.0 times |
Interpretation from Lending & Analytical Perspective
1. Financial Strength (Net Worth Ratio – 37.5%)
- Moderate proportion of assets funded by equity
- Indicates balanced ownership support
Lender Insight: Acceptable, but not very strong cushion
2. Efficiency (Capital Turnover – 2.0 times)
- Company generates Rs 2 of sales for every Rs.1 invested
Insight: Efficient utilization of capital
3. Risk Profile (Capital Gearing – 1.67: 1)
- Higher proportion of fixed-cost funds
Lender Insight: Moderately leveraged risk exists but manageable
Profitability (ROE – 40%)
- Strong return to shareholders
Caution: May be partly driven by leverage
5. Solvency (Debt–Equity – 1.33: 1)
- Reasonable mix of debt and equity
Lender Insight: Within acceptable limits
6. Interest Servicing (ICR – 3.0 times)
- Earnings comfortably cover interest obligations
Lender Insight: Adequate repayment capacity
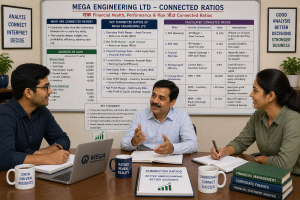
Integrated credit view
| Aspect | Observation | Risk level |
| Equity Strength | Moderate | Medium |
| Capital Efficiency | Strong | Low Risk |
| Leverage | Moderate | Manageable |
| Profitability | High | Positive |
| Interest Coverage | Adequate | Comfortable |
| Overall Position | Balanced but leveraged | Cautious approval |
helped a lot for preparing the final analysis of L&T project
Good
Good to know!