

In the world of accounting, “profit” and “cash” are not always the same. A company may report a strong Profit After Tax (PAT) under the Statement of Profit & Loss prepared in accordance with GAAP, Accounting Standards and Schedule III of the Companies Act, yet still face cash shortages in day-to-day operations. This happens because PAT is influenced by several accounting adjustments such as depreciation, amortisation, provisions, accruals, outstanding expenses and other non-cash items.
On the other hand, Cash flow from Operating Activities (CFOP) under AS 3 focuses on a question:
“How much actual cash has the business generated from its core operations?”
Therefore, while PAT reflects accounting profitability, operating cash flow reflects operational liquidity and cash efficiency. AS 3 generally emphasizes cash generated from regular business activities and largely separates non-operating or investing incomes from core operating performance.
A sound financially sound company is expected not only to earn accounting profit but also to convert that profit into real operating cash. Hence, modern financial analysis connects PAT, EPS and Cash flow from operations together to evaluate the true quality, sustainability and strength of business performance.
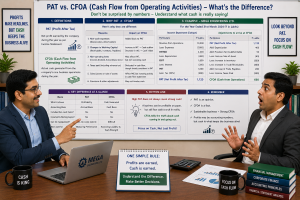
Connecting PAT (Income Statement) with Cash from Operating Activities (AS 3)
- Part II of Schedule III (Statement of Profit & Loss) tells us
→ profit earned - AS 3 Cash Flow Statement tells us
→ actual cash generated
A company may show high PAT but poor operating cash flow. Therefore, both statements must be studied together.
The final profitability indicator becomes:
PAT = Profit after Tax and
EPS = PAT – Preference Dividend/ Number of Equity Shares
Move to AS 3 Cash Flow Statement
Under indirect method:3
We start with PAT and convert accounting profit into operating cash.
Core structure
Cash from Operating Activities = PAT+ Non-Cash Expenses Working Capital Changes
This creates the practical connection between:
- accrual accounting
- real liquidity
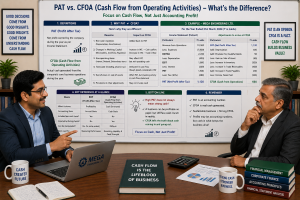
Why PAT and Operating Cash Flow differ
| PAT Includes | CFOA focuses on |
| Accrued income | Actual cash received |
| Credit sales | Cash collections |
| Depreciation expense | Added back (non-cash) |
| Outstanding expenses | Adjusted through WC changes |
| Accounting profit | Cash reality |
PAT is “Accounting Profit”
It is based on:
- matching concept
- accrual concept
- depreciation
- provisions
Operating Cash Flow indicates – How much cash did business operations generate?”
Let’s understand this concept from the financial records (extracts) of a company, as practical numerical information always helps students connect accounting concepts more clearly. This numerical illustration will help us analyse the relationship between PAT, working capital adjustments and Cash Flow from Operating Activities in a more meaningful and practical manner.

Case Study
Calibration Engineering is a medium-sized manufacturing company engaged in the production of industrial electrical components supplied to dealers and small engineering units across India. During the financial year, the company experienced growth in sales mainly through credit-based transactions and expansion of inventory to meet increasing market demand.
Although the company reported a satisfactory Profit After Tax (PAT) in its Statement of Profit & Loss prepared under applicable accounting principles and Schedule III of the Companies Act, management observed that actual cash generation from operations was comparatively lower. Therefore, the following financial extracts have been analysed to understand the practical relationship between accounting profit and Cash Flow from Operating Activities (CFOA) under AS 3.
Statement of Profit & Loss (Extract)
| Particulars | Amount (Rs.) |
| Revenue from Operations | 50,00,000 |
| Other Operating Income | 1,00,000 |
| Total Operating Revenue | 51,00,000 |
| Operating & Administrative Expenses | (38,00,000) |
| Salary & Employee Benefits | (3,00,000) |
| Depreciation & Amortisation | (2,00,000) |
| Operating Profit (EBIT) | 8,00,000 |
| Less: Interest Expense | (50,000) |
| Profit Before Tax (PBT) | 7,50,000 |
| Less: Tax Expense | (2,50,000) |
| Profit After Tax (PAT) | 5,00,000 |
Additional Information
| Particulars | Increase / (Decrease) |
| Trade Receivables increased | 2,50,000 |
| Inventory increased | 1,00,000 |
| Trade Payables increased | 80,000 |
| Outstanding Salary increased | 20,000 |
| Depreciation included in expenses | 2,00,000 |
| Interest actually paid | 50,000 |
| Income Tax actually paid | 2,20,000 |
Cash Flow from Operating Activities (Indirect Method)
| Particulars | Amount (₹) |
| Profit After Tax (PAT) | 5,00,000 |
| Add: Depreciation & Amortization | 2,00,000 |
| Operating Profit before Working Capital Changes (A) | 7,00,000 |
Adjustments for Working Capital Changes
| Particulars | Amount Rs) |
| Increase in Trade Receivables | (2,50,000) |
| Increase in Inventory | (1,00,000) |
| Increase in Trade Payables | 80,000 |
| Increase in Outstanding Salary | 20,000 |
| Net Working Capital Adjustment(B) | (2,50,000) |
| Particulars | Amount (Rs) |
| Cash Generated from Operations (A-B) | 4,50,000 |
| Less: Income Tax Paid | (2,20,000) |
| Net Cash from Operating Activities | 2,30,000 |
Cash Flow from Financing Activities
| Particulars | Amount (₹) |
| Interest Paid (Finance Cost) | (50,000) |
| Net Cash used in Financing Activities | (50,000) |
Comparative Analysis
| Indicator | Amount (Rs) |
| Profit After Tax (PAT) | 5,00,000 |
| Net Cash from Operating Activities | 2,30,000 |
Analytical Interpretation
Although the company earned an accounting profit of Rs.5,00,000, the actual operating cash generated was only Rs.2,30,000 because:
- higher funds were blocked in receivables,
- inventory level increased,
- taxes were paid in cash,
depreciation reduced accounting profit but did not involve cash outflow.
Brain storming discussion.