

The Cash Flow Story
Mahatma Ltd. — Cash Flow Statement under AS 3, Year Ended 31 March 2026
Profit Went Up. So Why Is Cash Down?
Mahatma Ltd.’s Profit & Loss Account looks healthy at first glance — the company earned a net profit of about Rs. 62,000 after tax for the year, and reserves grew too. A casual reader of the Balance Sheet might stop there and call it a good year.
But profit is an opinion; cash is a fact. And when we trace where every rupee actually moved under Accounting Standard 3 (Cash Flow Statements), a very different story emerges — one where the company’s core operations consumed cash rather than generated it, and a fresh mortgage loan quietly bridged the gap.
Act I: Reconstructing the Numbers
Before building the Cash Flow Statement, we reconstruct the Balance Sheet movements and the hidden P&L workings from the additional information given.
| Particulars | 31.3.2025 (Rs.) | 31.3.2026 (Rs.) | Change (Rs.) |
| Liabilities | |||
| Share Capital | 4,50,000 | 4,50,000 | — |
| General Reserve | 3,00,000 | 3,10,000 | +10,000 |
| Profit & Loss A/c | 56,000 | 68,000 | +12,000 |
| Creditors | 1,68,000 | 1,34,000 | (34,000) |
| Provision for Taxation | 75,000 | 10,000 | (65,000) |
| Mortgage Loan | — | 2,70,000 | +2,70,000 |
| Total Liabilities | 10,49,000 | 12,42,000 | +1,93,000 |
| Assets | |||
| Fixed Assets | 4,00,000 | 3,20,000 | (80,000) |
| Investments | 50,000 | 60,000 | +10,000 |
| Stock | 2,40,000 | 2,10,000 | (30,000) |
| Debtors | 2,10,000 | 4,55,000 | +2,45,000 |
| Bank | 1,49,000 | 1,97,000 | +48,000 |
| Total Assets | 10,49,000 | 12,42,000 | +1,93,000 |
| A note on the numbers Provision for Taxation as at 31 March 2026 works out to Rs. 10,000 and closing bank balance of Rs. 1,97,000. |
| Additional Information (as given in the problem) (i) Investments costing Rs. 8,000 were sold during the year 2025-26 for Rs. 8,500. (ii) Provision for tax made during the year was Rs. 9,000. (iii) During the year, part of the fixed assets costing Rs. 10,000 was sold for Rs. 12,000 and the profit was included in the Profit & Loss Account. (iv) Dividends paid during the year amounted to Rs. 40,000. |
This is exactly the “given” data students receive in the original problem — the four workings below show how each line is put to use.
Working 1 — Net Profit before Tax
Closing P&L balance (Rs. 68,000) = Opening P&L balance (Rs. 56,000) + Net Profit after tax − Transfer to General Reserve (Rs. 10,000) − Dividend Paid (Rs. 40,000). Solving, Net Profit after tax = Rs. 62,000. Adding back the Provision for Tax made during the year (Rs. 9,000) gives Net Profit before Tax = Rs. 71,000 — the starting point for the indirect method.
Working 2 — Provision for Taxation Account (Tax Paid)
Opening balance (Rs. 75,000) + Provision made during the year (Rs. 9,000) − Closing balance (Rs. 10,000) = Tax Paid during the year = Rs. 74,000.
Working 3 — Fixed Assets and Depreciation
Opening Fixed Assets Rs. 4,00,000, less cost of assets sold Rs. 10,000, leaves Rs. 3,90,000. The closing balance is Rs. 3,20,000, so depreciation charged for the year = Rs. 70,000. The assets sold (book value Rs. 10,000) fetched Rs. 12,000 — a profit on sale of Rs. 2,000, already sitting inside net profit and needing to be stripped out as a non-operating item.
Working 4 — Investments
Investments costing Rs. 8,000 were sold for Rs. 8,500 (profit of Rs. 500). Opening Rs. 50,000 less cost sold Rs. 8,000 leaves Rs. 42,000; the closing balance is Rs. 60,000, so fresh investments of Rs. 18,000 were purchased during the year.
Act II: The Cash Flow Statement (AS 3, Indirect Method)
With the workings in place, the full statement follows the three-activity structure AS 3 prescribes — Operating, Investing and Financing.
| Particulars | Amount (Rs.) |
| A. Cash Flow from Operating Activities | |
| Net Profit before Tax (as reconstructed) | 71,000 |
| Add: Depreciation on Fixed Assets | 70,000 |
| Less: Profit on Sale of Fixed Assets | (2,000) |
| Less: Profit on Sale of Investments | (500) |
| Operating Profit before Working Capital Changes | 1,38,500 |
| Add: Decrease in Stock | 30,000 |
| Less: Increase in Debtors | (2,45,000) |
| Less: Decrease in Creditors | (34,000) |
| Cash Generated from / (Used in) Operations | (1,10,500) |
| Less: Income Tax Paid | (74,000) |
| Net Cash Used in Operating Activities (A) | (1,84,500) |
| B. Cash Flow from Investing Activities | |
| Sale of Fixed Assets | 12,000 |
| Sale of Investments | 8,500 |
| Purchase of Investments | (18,000) |
| Net Cash from Investing Activities (B) | 2,500 |
| C. Cash Flow from Financing Activities | |
| Proceeds from Mortgage Loan | 2,70,000 |
| Dividend Paid | (40,000) |
| Net Cash from Financing Activities (C) | 2,30,000 |
| Net Increase in Cash and Cash Equivalents (A+B+C) | 48,000 |
| Add: Cash and Bank Balance as at 1 April 2025 | 1,49,000 |
| Cash and Bank Balance as at 31 March 2026 | 1,97,000 |
| Why indirect method? AS 3 permits either the direct or indirect method for operating activities; most Indian companies use the indirect method because it starts from reported profit — already available from the P&L — and simply adjusts for non-cash items and working-capital movements, avoiding a fresh line-by-line recast of receipts and payments. |
Act III: The Visual Story
Numbers on a table rarely tell their own story — charts do. Here’s the same Cash Flow Statement, seen through two lenses.
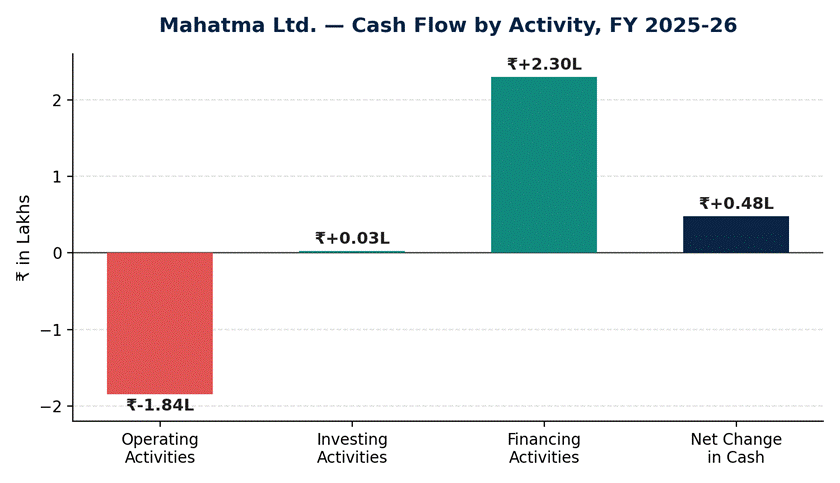
Chart 1 — Net cash flow by activity. Operating activities alone consumed Rs. 1.84 lakh; a financing inflow of Rs. 2.30 lakh kept the company’s cash position positive.
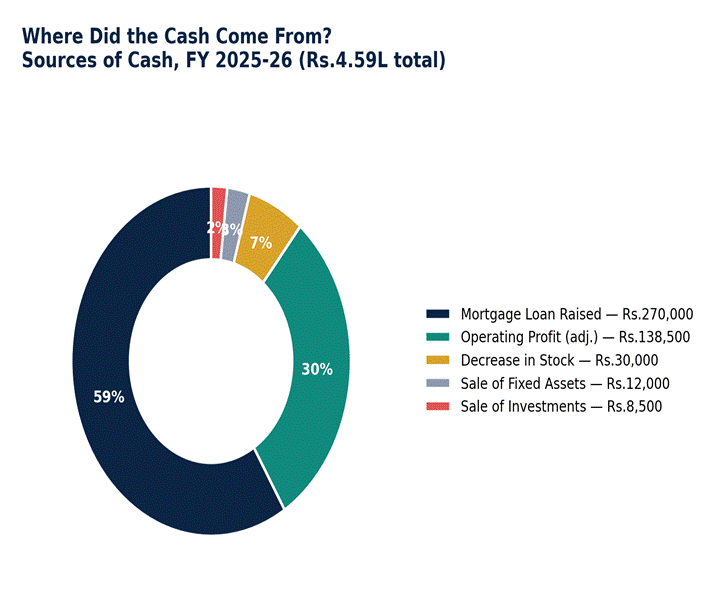
Chart 2 — Sources of cash. 58.8% of all cash raised this year came from the mortgage loan, not from the business itself.
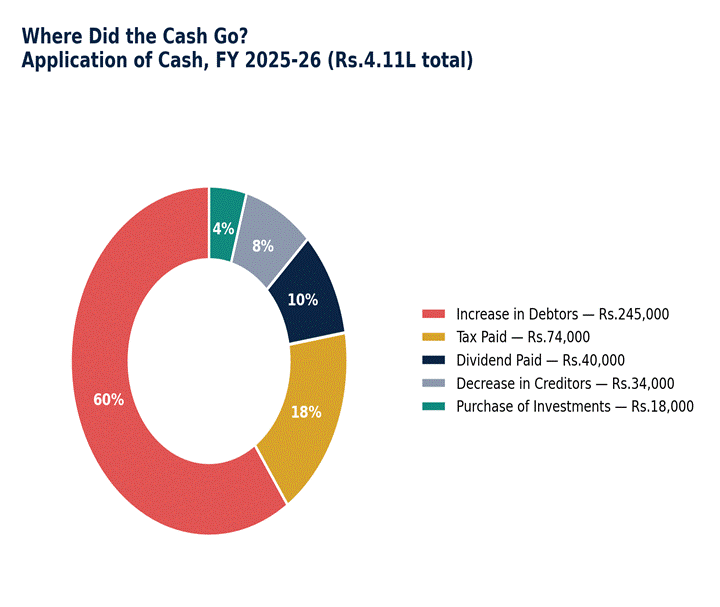
Chart 3 — Application of cash. Nearly 60 paise of every rupee that left the business went into financing customers who haven’t paid yet (Debtors).
Act IV: The Takeaway
What the numbers are really saying
- Operating cash flow is deeply negative (Rs. 1.84 lakh) despite a positive accounting profit of Rs. 71,000 before tax — a classic profit-cash divergence.
- The single biggest cash drain is the Rs. 2.45 lakh jump in Debtors — receivables more than doubled year-on-year, tying up cash that should have come back into the business.
- Creditors fell by Rs. 34,000 at the same time — the company paid suppliers faster while collecting from customers slower, a double squeeze on working capital.
- The Rs. 2.70 lakh mortgage loan is what actually kept the bank balance rising (Rs. 1.49 lakh to Rs. 1.97 lakh) — the growth in cash this year was borrowed, not earned.
- Investing activities were broadly cash-neutral (Rs. 2,500 net inflow): asset and investment sales roughly offset a fresh investment purchase.
How a consultant would frame this to the company’s management
From the company’s perspective, this year’s story is defensible but needs a clear narrative for the Board and lenders: growth is real — debtors have grown because sales or credit terms have expanded, and the mortgage loan was a deliberate, planned financing decision, not a distress signal. A consultant would justify the position as follows:
- Frame the debtors build-up as a sales-growth investment: if turnover grew alongside receivables, this is working-capital funding a larger business, not a collection failure — but it should be backed by an ageing schedule to prove collectability.
- Position the mortgage loan as prudent long-term financing of working capital rather than short-term stopgap borrowing — long-tenure secured debt against a growing balance sheet is a reasonable match of asset and liability duration.
- Show that operating cash flow, while negative this year, is a working-capital timing issue rather than a profitability issue — the underlying adjusted operating profit before working-capital changes was a healthy Rs. 1,38,500.
- Commit to a corrective ask internally: tighten the credit period on debtors and negotiate the creditor payment cycle back out, so that next year’s Cash Flow Statement shows operating activities turning cash-positive again.
The honest caveat a consultant should not hide: if this receivables pattern repeats next year, it stops being a growth story and starts being a collections problem — and the mortgage loan, having already been drawn once to cover the gap, will not be available to repeat the trick.
This was something different in a different way. Thanks a lot sir.