
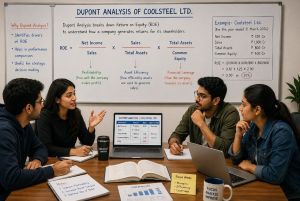
DuPont Analysis of Coolsteel Ltd.
Is Coolsteel’s ROE driven by Profitability, Efficiency, or Leverage?
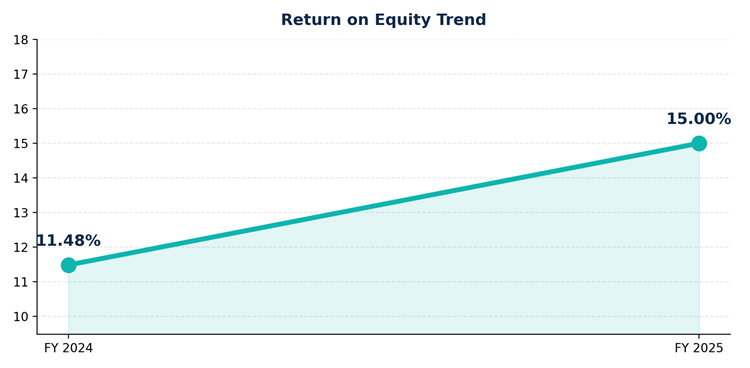
| ROE FY 2025 15.00% up from 11.48% in FY24 | EBIT MARGIN 16.00% up from 13.00% in FY24 | ASSET TURNOVER 0.80× up from 0.75× in FY24 |
FINANCIAL SNAPSHOT (₹ CRORE)
| Particulars (₹ crore) | FY 2024 | FY 2025 |
| Revenue from Operations | 8,500 | 10,000 |
| EBIT | 1,105 | 1,600 |
| Finance Cost | 250 | 300 |
| Profit Before Tax | 855 | 1,300 |
| Tax Expense | 132.5 | 300 |
| Profit After Tax | 722.5 | 1,000 |
| Opening Total Assets | 10,666 | 12,000 |
| Closing Total Assets | 12,000 | 13,000 |
| Average Total Assets | 11,333 | 12,500 |
| Opening Shareholders’ Equity | 6,000 | 6,333 |
| Closing Shareholders’ Equity | 6,592 | 7,000 |
| Average Equity | 6,296 | 6,667 |
ROE TREND
DUPONT FORMULA: ROE = MARGIN × TURNOVER × LEVERAGE
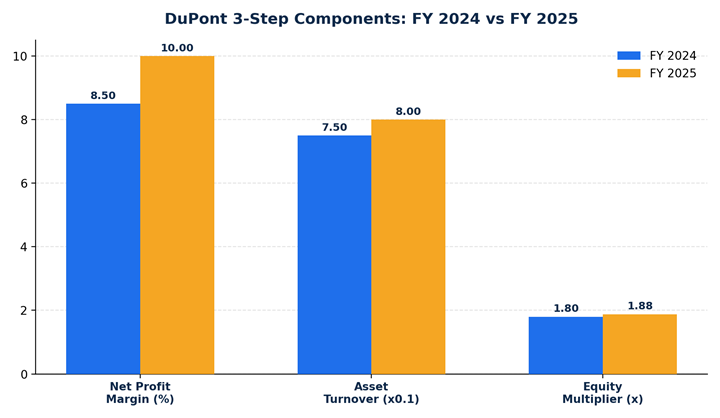
| DuPont Component | FY 2024 | FY 2025 | What it tells us |
| Net Profit Margin | 8.50% | 10.00% | Profitability improved |
| Asset Turnover | 0.75× | 0.80× | Asset utilisation improved, but remains relatively low |
| Equity Multiplier | 1.80× | 1.88× | Moderate increase in financial leverage |
| ROE | 11.48% | 15.00% | Strong overall improvement |
WHAT DROVE THE ROE IMPROVEMENT?
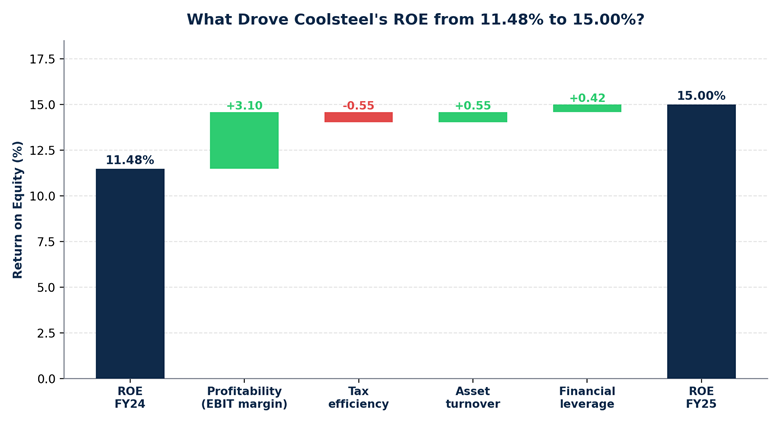
ROE increased from 11.48% to 15.00% — a rise of approximately 3.52 percentage points — driven mainly by stronger operating profitability, aided by improved asset utilisation and a modest rise in financial leverage, while a higher tax burden partially offset the gains.
OBSERVATION: IS A 0.80× ASSET TURNOVER WEAK?
Coolsteel’s Asset Turnover is only 0.80×. That means for every ₹1 invested in assets, Coolsteel generates only about ₹0.80 of revenue. At first glance this may appear weak — but that conclusion would be misleading.
Steel manufacturing is capital intensive. Large investments in the following can keep the asset base high:
● Plant & machinery
● Steel processing facilities
● Warehouses
● Power infrastructure
● Transportation equipment
● Technology
Therefore, a lower asset turnover does not automatically mean poor management.
5-STEP DUPONT ANALYSIS
| Step | Component | Formula | FY24 | FY25 | What it indicates |
| 1 | Tax Retention Factor | PAT ÷ PBT | 84.50% | 76.92% | Profit retained after tax |
| 2 | Interest Retention Factor | PBT ÷ EBIT | 77.38% | 81.25% | Operating profit retained after finance cost |
| 3 | Operating Profit Margin | EBIT ÷ Sales | 13.00% | 16.00% | Operating profitability |
| 4 | Asset Turnover | Sales ÷ Avg. Total Assets | 0.75× | 0.80× | Efficiency of asset utilisation |
| 5 | Financial Leverage | Avg. Assets ÷ Avg. Equity | 1.80× | 1.88× | Use of assets relative to equity |
| ROE | Step1×2×3×4×5 | 11.48% | 15.00% | Overall return to shareholders |
THE STORY OF COOLSTEEL LTD.
| PROFITABILITY EBIT margin: 13% → 16% This is the biggest positive signal. Possible reasons: better capacity utilisation, improved product mix, operating cost control, economies of scale, and improved realisation/pricing. |
| EFFICIENCY Asset turnover: 0.75× → 0.80× The company is still asset-heavy, but it is generating more sales from its asset base. |
| LEVERAGE Equity multiplier: 1.80× → 1.88× Coolsteel is using somewhat more financial leverage. This helped enhance ROE, but it also introduces additional financial risk. |
| TAX Tax retention: 84.50% → 76.92% A smaller proportion of PBT was converted into PAT in FY2025, so taxation partially offset the improvement coming from operating performance. |
MANAGEMENT CONCLUSION
| Coolsteel Ltd.’s ROE increased from 11.48% to 15.00% in FY2025. The improvement was primarily supported by stronger operating profitability, reflected in the increase in EBIT margin from 13% to 16%. Asset turnover also improved from 0.75× to 0.80× despite Coolsteel’s capital-intensive business model. A moderate increase in financial leverage further supported ROE. However, management should monitor leverage carefully and ensure that the improvement in ROE is increasingly supported by operating performance rather than debt. |
Advanced topics need new version of presenting, but sir missing your older version too. Thanks for uploading this blog.