The professor looks at the students and says,
Students, case studies are excellent for understanding concepts in real life.
But in corporate finance, true clarity comes only when concepts are tested with numbers.
He pauses, scans the classroom, and continues,
Stories help you visualize a situation, but figures help you understand the logic behind decisions.
Then he smiles and adds,
So, let’s not stop at the case study.
Let’s take an imaginary company, Oxkart—an online retail giant—and trace its journey through figures to understand how corporate finance decisions shape risk and return.
The professor turns towards the smart board, picks up the pen, and says,
Now, let’s go through this imaginary case study step by step

Phase 1: Early Startup Phase (Low Risk)
Oxkart Company (initial stage – illustrative numbers):
- Sales: Rs.50 crores
- Variable costs: Rs.35 crores
- Fixed operating costs: Rs.10 crores
- Operating Statement
| Particulars | Amount (Rs. crore) |
| Sales | 50 |
| Variable Cost | (35) |
| Contribution | 15 |
| Fixed Cost | (10) |
| EBIT | 5 |
Ratios
- Operating Leverage (DOL)
Interpretation:
A 1% change in sales leads to 3% change in EBIT — moderate risk.

Stage 2: Expansion Phase (High Operating Risk)
Oxkart builds warehouses & tech infrastructure.
New numbers:
- Sales: Rs.200 crore
- Variable costs: Rs.130 crore
- Fixed operating costs: Rs.50 crore
Operating Statement
| Particulars | Amount (Rs. crore) |
| Sales | 200 |
| Variable Cost | (130) |
| Contribution | 70 |
| Fixed Cost | (50) |
| EBIT | 20 |
Operating Leverage (DOL)
Risk has increased:
Sales volatility now affects profits more sharply.

Stage 3: Financial Leverage Enters
To fund expansion:
- Debt: Rs.60 crore
- Interest: 10% — Rs.6 crore
Income Statement
| Particulars | Amount (₹ crore) |
| EBIT | 20 |
| Interest | (6) |
| EBT | 14 |
Financial Leverage (DFL)
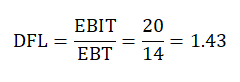
Interpretation:
Equity profits are 43% more volatile than EBIT

Stage 4: Combined Risk Picture
Combined Leverage (DCL)
DCL=DOL×DFL=3.5×1.43=5
Meaning:
A 1% change in sales causes 5% change in EPS.

Stage 5: Linking to Return Expectations (CAPM feel)
Investors observe:
- High DOL
- High DFL
- High earnings volatility
They demand:
- Higher expected return
- Higher valuation discount rate
Risk–Return Summary Table
| Risk Type | Ratio Used | Effect |
| Operating Risk | DOL | EBIT volatility |
| Financial Risk | DFL | EPS volatility |
| Total Risk | DCL | Shareholder risk |
| Market View | Beta | Required return |
The professor steps back from the smart board, exchanging a few final thoughts with the students. Some students nod in agreement, while others quietly discuss the numbers among themselves, revisiting the figures and ratios once more.
Soft conversations ripple across the classroom—operating leverage, financial risk, beta—the terms still resonating in their minds.

As the professor gathers his notes, one idea lingers clearly in the room:Risk… and return….