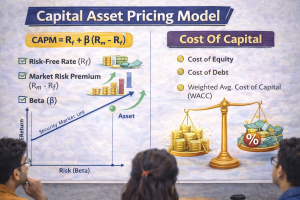
The Capital Asset Pricing Model (CAPM) is an equation that describes the relationship between the expected return of an investment and its risk. CAPM quantifies investment risk through beta, allowing investors to compare the volatility of an asset to the market.
If you need to clear your concept of CAPM, let’s go through this classroom discussion together.
Professor: If you invest in a Fixed Deposit and get 7%, and someone asks you to invest in shares, will you accept the same 7% return?
Students say: No!
Professor: why?
Students: because shares are risky.
That difference between safe return and required return is the foundation of Cost of Equity.

Let’s connect CAPM and Cost of Equity
What is Cost of Capital?
Students:
Required rate of return
Minimum return expected by investors
Opportunity cost
Professor: Cost of Capital is the minimum return a company must earn to satisfy its investors.
For debt → Interest rate
For preference → Dividend rate
For equity → Required return
Professor: but here comes the real question: how do we calculate Cost of Equity?
This is where CAPM enters.
CAPM:
Professor: why will equity investors demand more than fixed deposit?
Because of:
- Business risk
- Market volatility
- Uncertainty
CAPM explains how much extra return they demand.
Break Down the Components:
Risk-Free Rate (Rf)
Professor: What is the safest investment in India?
Students: Government Securities
Professor: Yes
Example: 10-year Government Bond yield = 7%, that is Rf

Professor: If you invest in the stock market long term, what average return do you expect?
Example:
- Nifty long-term average ≈ 12–14%
Suppose: Rm = 13%
Market Risk Premium (Rm – Rf) :
This 6% is the extra reward for taking market risk.
Professor: Do all shares move the same way as the market?
Professor: No
Suppose
- β = 1 → Moves exactly like market
- β > 1 → More volatile
- β < 1 → Less volatile
Example:
- Defensive FMCG company → β = 0.8
- IT or tech company → β = 1.3
Assume:
Rf = 7%
Rm = 13%
β = 1.5
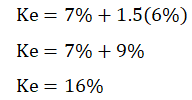
Professor: If the company earns only 12%, is it creating value?
Students: No, because investors require 16%.
This directly connects CAPM to Cost of Capital.
CAPM is a tool used to estimate Cost of Equity, which is a component of WACC.
Case Study: CAPM and Cost of Capital in Decision-Making
RST Ltd. has the following capital structure (Market Value basis):
| Source | Amount (₹) |
| Equity | 60,00,000 |
| Debt | 40,00,000 |
| Total | 1,00,00,000 |
Additional Information:
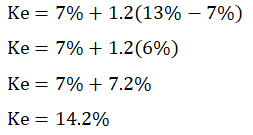
- Risk-Free Rate (Rf) = 7%
- Market Return (Rm) = 13%
- Beta (β) = 1.2
- Cost of Debt (before tax) = 10%
- Tax Rate = 30%
The company is evaluating a project expected to earn 14% return.
Now,
Kd=10%(1−0.30)
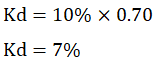
After-tax Cost of Debt = 7%
Calculate WACC
Weights:
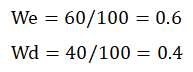
Now:
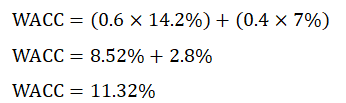
WACC = 11.32%
Investment Decision
Project Return = 14%
WACC = 11.32%
Professor: is the project acceptable?
Because: Return>WACC
It creates value.
Let’s connect with investment of = Rs.1 crore
Expected Return = 14%
Profit = 14% × 1,00,00,000
= Rs.14,00,000
Capital Charge:
1,00,00,000×11.32%=11,32,000
EVA: 14,00,000−11,32,000
𝐄𝐕𝐀=Rs. 𝟐,𝟔𝟖,𝟎𝟎𝟎
Positive EVA → Value Created
What if Beta increases to 1.8?
Recalculate quickly in class:
Ke=7+1.8(6)=7+10.8=17.8%
New WACC: 0.6×17.8)+(0.4×7=13.48%
Now compare:
Project return = 14%
WACC = 13.48%
Still acceptable… but value creation reduced.
If risk increases further → Project may become unacceptable.
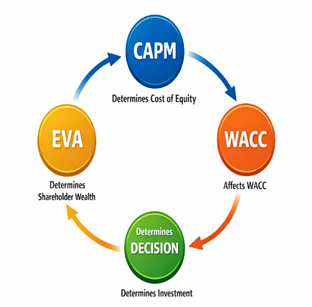
Takeaway:
| CAPM Cost of Equity WACC Investment Decision EVA | Determines Cost of Equity Affects WACC Determines Investment Decision Determines EVA 9Determines Shareholder Wealth |